How to Test Fiber Optic Insertion Loss and Return Loss: A Complete Guide
Why Insertion Loss and Return Loss Matter
Every fiber optic link in a data center, FTTx network, or 5G fronthaul deployment lives or dies by two numbers: Insertion Loss (IL) and Return Loss (RL). They are the vital signs of the optical channel — IL tells you how much signal you lose moving forward through the link; RL tells you how much signal bounces back toward the transmitter and corrupts what is coming next.
For procurement teams and field engineers buying patch cords, MTP/MPO trunks, or PLC splitters, understanding how these values are measured is the difference between an installation that passes acceptance testing the first time and one that you spend a week troubleshooting. This guide walks through the definitions, the dominant test methods, and the realistic spec windows you should hold your suppliers to.
Insertion Loss (IL), Explained
Insertion Loss is the total optical power lost between the input and output of a fiber assembly, measured in decibels:
IL = −10 · log(Pout / Pin)
Because it is a logarithmic ratio, smaller is better. A 0.20 dB patch cord is materially better than a 0.35 dB one — at scale across hundreds of links inside a spine-leaf fabric, those tenths of a dB decide whether your 400G optics close the link budget.
Loss comes from two sources:
Intrinsic: attenuation inside the fiber itself (fixed by fiber type and length).
Extrinsic: connector end-face quality, ferrule alignment, contamination, splices, and bends — this is where assembly quality dominates.
Typical industry maximums Firsol holds itself to:
Assembly Type | Max IL (Single-mode) | Max IL (Multimode) |
|---|---|---|
LC / SC / FC duplex patch cord | ≤ 0.30 dB | ≤ 0.20 dB |
MTP/MPO trunk (12F / 24F) | ≤ 0.35 dB | ≤ 0.35 dB |
Fusion splice | ≤ 0.10 dB | |
Return Loss (RL), Explained
Return Loss measures the reflected power that travels back toward the source whenever light hits a discontinuity (a connector pair, a splice, a fiber end):
RL = −10 · log(Preflected / Pinput)
RL is reported as a positive number in dB, and larger is better — a higher number means a weaker reflection. Reflections matter because they create noise, destabilize laser sources, and at high data rates (25G/50G/100G per lane) directly raise the bit-error rate.
End-face polish dictates the achievable RL:
PC (Physical Contact): RL > 40 dB
UPC (Ultra Physical Contact): RL > 50 dB
APC (Angled Physical Contact, 8°): RL > 60 dB
Multimode connectors: typically 20–40 dB (reflections are less critical at LED/VCSEL wavelengths)
The Three Things That Wreck Your Numbers
1. Dirty End-Faces
A single-mode core is 9 µm. A speck of dust is bigger. Always inspect with a 200x/400x microscope and clean with a dedicated cassette cleaner before every reference and every test connection.
2. Mating Incompatible Connector Types
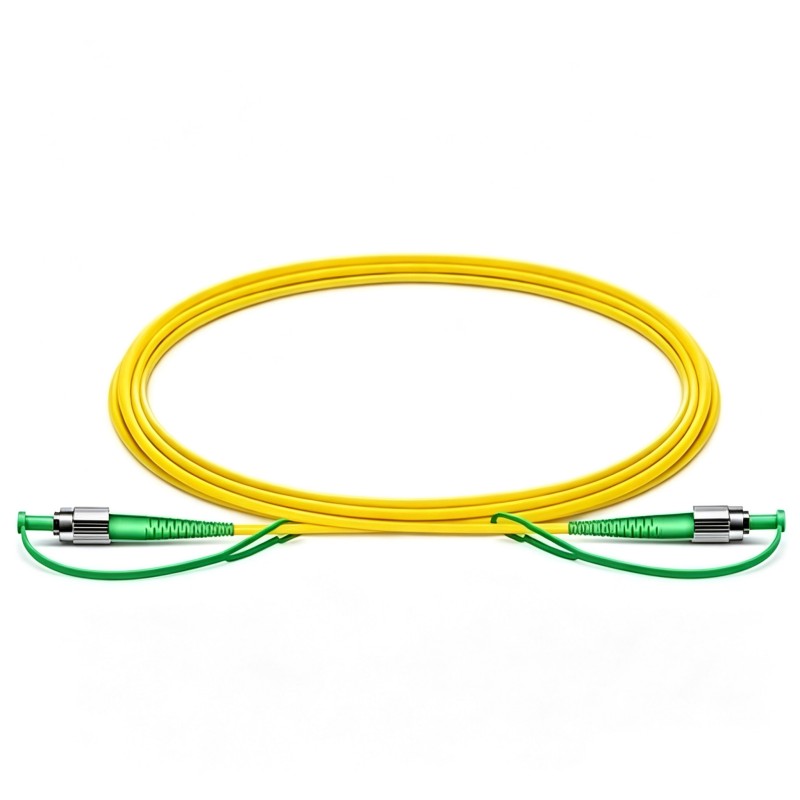
Plugging a UPC into an APC adapter is the most common — and most expensive — mistake on a job site. The 8° angle prevents physical contact, drives IL above 1 dB, and destroys the RL the APC was bought for. Color-code your inventory: blue = UPC, green = APC.
3. Bend Radius Violations
Rule of thumb: minimum bend radius = 10× cable jacket diameter. A standard 2 mm patch cord must never be bent tighter than a 20 mm radius. Tighter bends leak light immediately and can micro-fracture the glass permanently.
Method 1 — Light Source + Power Meter (OLTS, 1-Jumper Reference)
This is the gold standard for measuring IL on a finished link.
Set up: Wavelength-matched stable light source, calibrated power meter, two known-good reference cords, and a mating adapter.
Clean every connector — single most important step.
Establish 0 dB reference: Connect source → reference cord → power meter. Press Set Reference. The meter now reads 0.00 dB.
Insert the DUT: Disconnect at the meter, add the link under test plus a receive cord, reconnect.
Read IL directly in dB. Repeat at every required wavelength (typically 1310 / 1550 nm for SMF, 850 / 1300 nm for MMF).
Method 2 — OTDR (Optical Time Domain Reflectometer)
An OTDR is the right tool when you need to locate a problem, not just quantify it. It launches a pulse and measures backscattered light versus distance, producing a trace where every splice, connector, and bend appears as a discrete event.
Key parameter notes:
Pulse width: short (10 ns) for resolution near the launch, long (1 µs+) for distance and SNR on long-haul fibers.
Range: set ~20% beyond the expected fiber length.
Averaging: 30 s – 3 min for a clean trace.
Always use a launch cable (and ideally a receive cable) so the first and last connectors fall inside the measurable region, not in the dead zone.
The OTDR's event table will report distance, IL per event, and reflectance — exactly what you need for a fault report.
Method 3 — Dedicated IL/RL Tester
An integrated IL/RL tester (Main + Remote unit) is the most efficient option when you need both numbers in a single pass, which is standard for data center acceptance testing under TIA-568 or ISO/IEC 14763-3.
Connect Main and Remote with reference cords, clean everything.
Run the auto-reference routine — sets 0.00 dB for both IL and RL.
Insert the link under test between the two units.
Read IL (low number = good) and RL (high number = good) simultaneously, log per port.
Acceptance benchmarks typically used on Firsol assemblies:
Connector | IL Target | RL Target |
|---|---|---|
LC/UPC – LC/UPC SMF | ≤ 0.30 dB | ≥ 50 dB |
LC/APC – LC/APC SMF | ≤ 0.30 dB | ≥ 60 dB |
MTP/UPC 12F SMF trunk | ≤ 0.35 dB / fiber | ≥ 35 dB |
MTP/APC 12F SMF trunk | ≤ 0.35 dB / fiber | ≥ 55 dB |
Quick Decision Matrix: Which Tool Do You Need?
Goal | Recommended Tool |
|---|---|
Final acceptance testing of a single link | OLTS (light source + power meter) |
Locating a specific bad connector or splice | OTDR |
Measuring both IL and RL together at scale | Dedicated IL/RL tester |
QC on incoming patch cords and trunks | OLTS + interferometer + microscope |
How Firsol Builds to These Numbers
Every Firsol patch cord, MTP/MPO trunk, and pre-terminated assembly ships with a 3D interferometer test report verifying apex offset, radius of curvature, and fiber height — the geometry that determines whether IL and RL targets are physically achievable. We test 100% of finished assemblies with calibrated OLTS gear and reject anything outside the spec windows shown above.
If you are sourcing high-density LC duplex patch cords, MPO/MTP backbone trunks, or APC-polished assemblies for FTTH and 5G fronthaul, our engineering team can provide the exact IL/RL data sheet for your project.
→ Request a custom assembly quote with full IL/RL test reports
FAQ
What is the difference between Insertion Loss and Return Loss?
Insertion Loss measures power lost in the forward direction; Return Loss measures power reflected backward. Both are reported in dB. For IL, lower is better. For RL, higher is better.
How is Insertion Loss measured?
Most commonly with an Optical Loss Test Set (OLTS) — a calibrated light source and power meter, using a one- or three-jumper reference method.
How is Return Loss measured?
Either with a dedicated IL/RL tester (best for total link RL) or with an OTDR (best for locating individual reflective events).
What causes poor IL and RL?
Contaminated or damaged end-faces, mismatched polish types (UPC vs APC), poor ferrule geometry, micro-bends, and over-tight bend radii — in roughly that order of frequency.